Google Data Studio: A Free Dataviz Tool for your Reports
Data visualization (aka “dataviz”) has transformed SEO reporting forever. By turning raw data into fun, elegant visual objects and by integrating key figures into creative narratives, it has condemned the endless Excel spreadsheets and tedious slide presentations to join the relics of the prehistoric digital age.

In an ecosystem where dataviz tools are often relatively complex and mostly aimed towards seasoned users – in other words, most businesses won’t find them user-friendly – Google came up with a game-changing solution by launching Google Data Studio back in 2016. This solution is simple to access, clear, intuitive… as well as free! In this article, we’re going to explore Google’s very own dataviz tool and discuss its main benefits.
What Is Google Data Studio?
Google Data Studio is a reporting tool that provides Cloud-based Business Intelligence. It is essentially an improved version of the native reporting tool Google Analytics. Launched in 2016 and available to users for free, the solution allows them to create Data Studio reports, custom tables, and interactive graphs from external data sources. These documents can then be shared in real time with other users, partners, and prospects or clients.
Google Data Studio provides companies with everything they need to materialize large amounts of data in the form of charts and didactic reports. It can also be used to monitor key performance indicators, to keep an eye on trends, to share information with people, and, ultimately, to optimize your decision-making processes and help you become more competitive.
You can use Google Data Studio for SEO reports, Dataviz, and to share data with others.
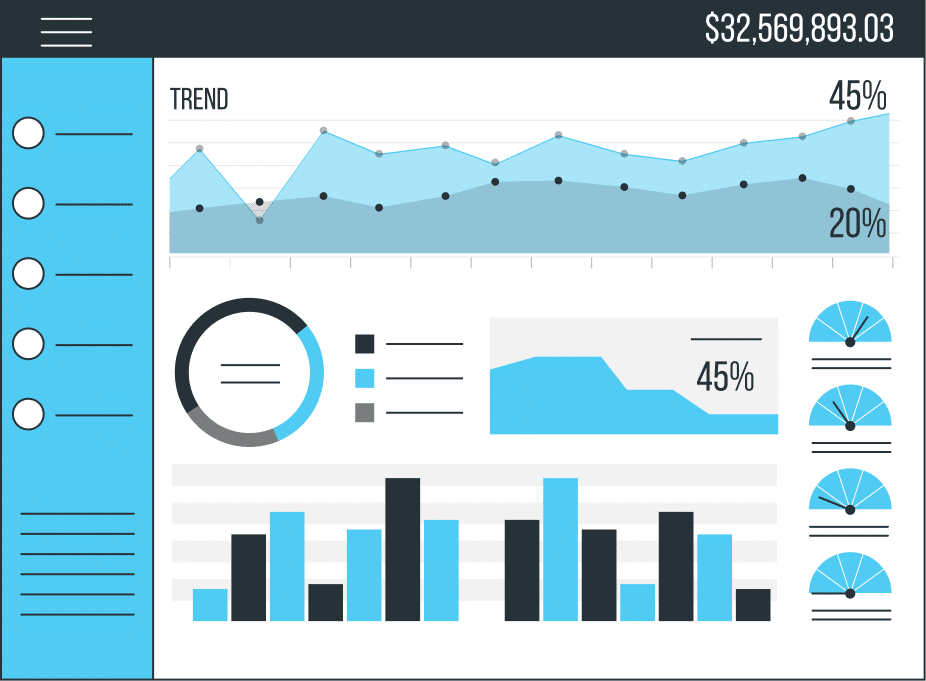
Below is an example of a native Google Data Studio template:
What Is Google Data Studio Used For?
You may be wondering how to use Google Data Studio for SEO reports, dataviz, or to gain access to external data.
In order to understand Google Data Studio, one needs to take a moment to examine the main features it puts at its users’ disposal. In essence, Google’s dataviz solution provides a simple way to do three things: visualize data, connect to external data sources, and share the documents created.
What is Google Data Studio Used for?
Data Visualization
This is the fundamental purpose of any data visualization tool: to provide means of visualizing data and turning it into easy-to-interpret documents, convenient and accessible to anyone. Google Data Studio allows you to create…
- Reports (dashboard) that you can add a bunch of filters and control tools to, based on a given date range.
- Dynamic cross-tabulations.
- Interactive graphs, with a high number of possibilities: lines, bar charts, sectors, maps, trend graphs, point clouds…
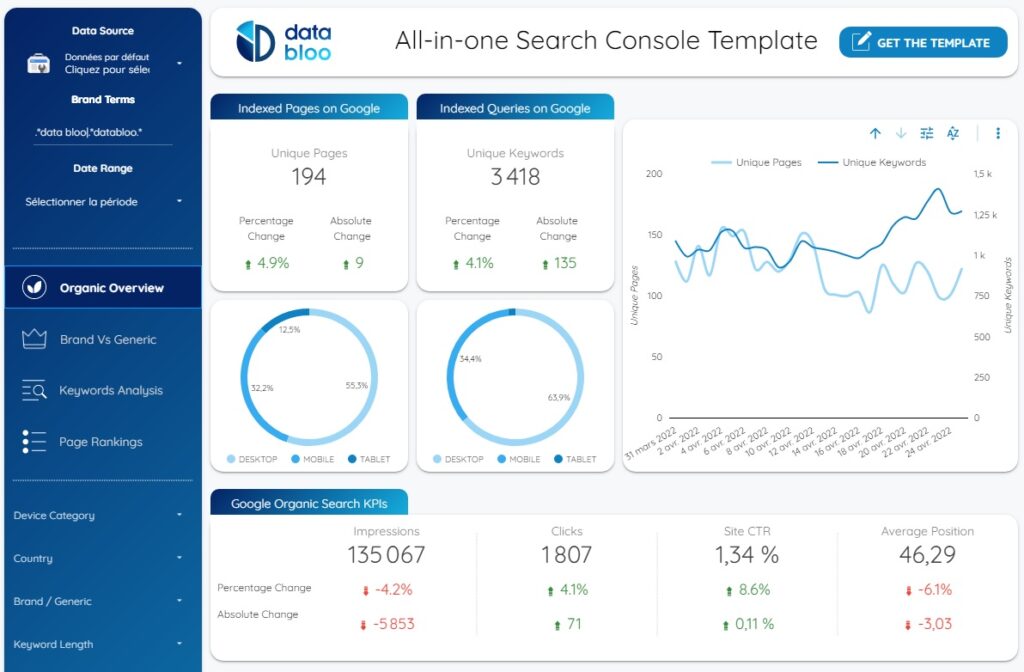
The tool offers a selection of templates that you can customize as you wish, depending on the type of data you are working with. For instance, for a streamlined understanding of your social media performance, you can use a dedicated dashboard template (see with Twitter and YouTube data in the example below).
You will also get the opportunity to utilize templates developed by the Google Data Studio community, which users can access for free.
External Data Access
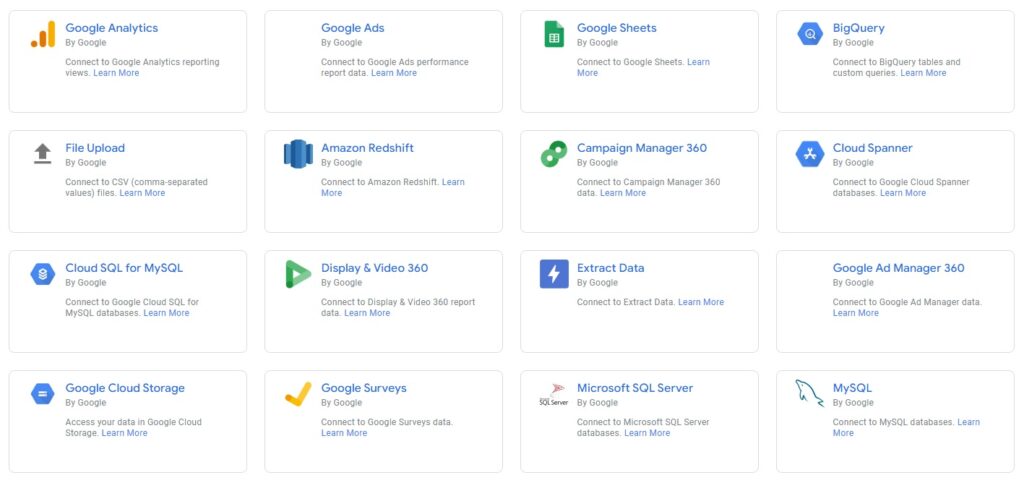
This is an essential feature for any data visualization tool: Being able to import data from external sources into the solution. By clicking the “data source” command, you can inject data into your reports, graphs, or tables from a variety of external sources, including Google Analytics, Google Ads, YouTube Analytics, Google Sheets, Google Search Console, social media Analytics, BigQuery, DCM, MySQL, PostgreSQL, Campaign Manager…
To this end, you’re going to need connectors. Every source has its own corresponding uniform data structure. A connector essentially plugs into the source’s API to connect to the data source and collect the information stored there. There are many different connectors, all of which are listed in a library. Google Data Studio currently offers over 800, some of which are free (mainly as far as services associated with Google go), while others are paid options (generally, these are the connectors provided by third-party platforms). The tool also features an alternative for users who can’t find the right connector, which is to create their own connector. This implies that they should master coding (and the solution even offers a Google Data Studio Tutorial).
Document Sharing and Live Collaboration
Once you have created and formatted your reports, tables, and graphs, all that’s left to do is to share them. Google Data Studio is designed for online collaboration. The documents stored on the Drive become accessible to invited users based on their level of authorization, which you can assign yourself (“view” or “edit”). The idea is that select users get to modify the documents or apply filters, while others can only peruse them. Another option consists in exporting the documents as PDFs, which can be useful if you wish to share them via email or to print them out. Note that any dynamic functionalities will be lost in the process.
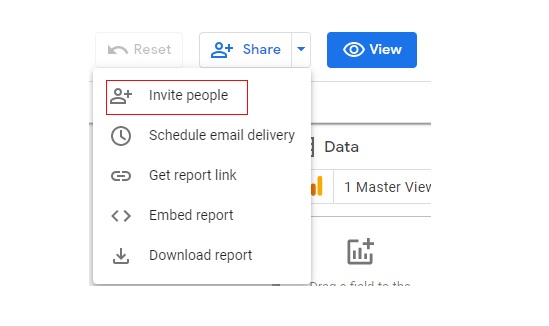
The good news is that Google Data Studio doesn’t set any limitations as to how many people can be given access to the documents you share. This means that you can share them with your entire staff, partners, and/or clients.
We have touched upon Google Data Studio’s main functionalities, but there are many more, including more advanced ones that will prove crucial for anyone looking to take their data analysis to the next level. For instance, you can use the tool to compare how metrics evolve over different date ranges, add data sources and dimension metrics, incorporate an additional dimension into a graph… It’s up to you to explore all the features based on what you need!
Head to the Google Data Studio tutorial to find out more about how to use Google Data Studio!
How to Use Google Data Studio to the Fullest? Main Benefits
Google’s data visualization tool offers a large number of benefits, which are well worth going over.
Ease of Use
That much is obvious: Google Data Studio was created to make data visualization more approachable and to allow anyone to generate reports and graphs intuitively, without spending a crazy amount of time on the task.

Which means it’s not surprising that the tool focuses on being ergonomic. The streamlined interface makes the initial encounter a positive one, the drag and drop functionality makes the solution intuitive, no one needs to master coding in any way, and the learning curve is short. The tool offers two modes to its users: “Edit”, which allows you to manage data sources and create documents, and “View”, through which you can peruse the data and interact with it.
And, for more seasoned users, the code is open so you can create more complex reports.
A Free Tool
Google Data Studio can be accessed for free, which contributes to making the solution even more approachable. Related applications which emanate from the Google ecosystem (Search Console, Analytics, etc.), are also free to use, as are their respective connectors.
Only some connectors developed by third parties involve additional fees. When they are required to access external data sources (on social media, for example), they do imply a few expenses.
The Google Data Studio tutorial, on the other hand, will help you learn how to use Google Data Studio for free.
Time Savings
Google Data Studio is designed to help organizations save time. The document creation method is quick and intuitive, the data is updated automatically and in real time whenever you peruse it, and you have immediate access to high-performance templates.
The time you save on reporting can be put towards your marketing strategy and your decision-making process, for example.
Customization

Google Data Studio offers several customization options, for the tool’s interface itself, as well as for the documents you edit.
Applying styles and colour themes, using filter controls, including text areas, shapes, clickable images or URLs, creating product catalogues, libraries, or hypertext content… You won’t be short on options!
Exploitable Data
This is a benefit that only dataviz tools can offer. These allow you to show clear, easy-to-interpret reports to your partners, customers, and staff. The reports are designed to highlight the data and instantly translate a raw source into a message anyone can understand. Being able to exploit the data this way represents a great added value for you as a company and as an employer.
Regular Updates
To end on a high note, let’s add that Google Data Studio has received regular improvements since its launch. New functionalities are integrated every now and then, answering the needs of data experts and marketers. In addition, the Google team keeps an ear out when it comes to comments from its community. This is how they make sure the upgrades align with the users’ expectations.
In conclusion, Google Data Studio is a tool that is effective, convenient, and easy to use all at once. It allows companies to step right into the era of data visualization and exploitation. Its clear, intuitive interface, its data presentation driven features, and its potential for collaboration (with the ability to share reports, tables, and graphs with an infinite number of users while granting each of them different privileges) make it a Business Intelligence must-have – especially since it’s free. You probably won’t find a better opportunity to get into dataviz!

Need to talk with an expert?