
Google PageSpeed Insights: Google’s Tool for Analysing Web Page Loading Speed
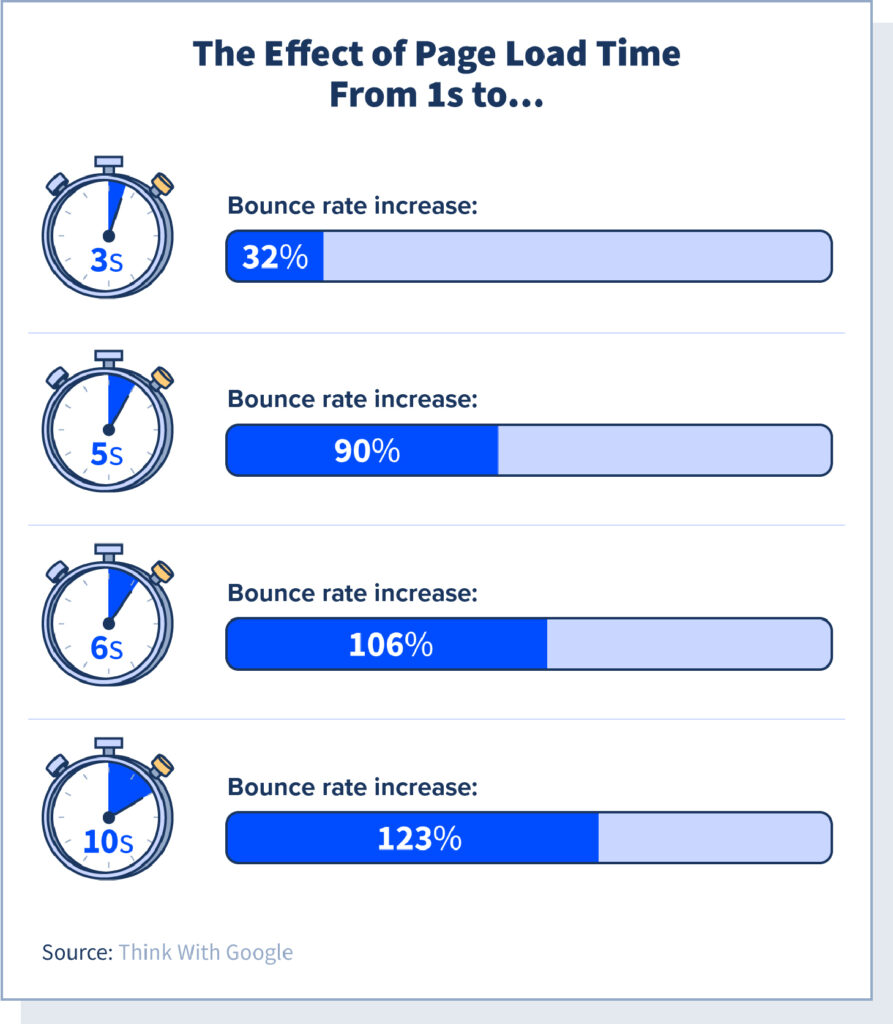
You know the old saying: Better to have a fast website than a slow one. Except that page load time is not just a matter of preference. It’s all about performance. The longer a page takes to be displayed, the more the user’s frustration escalates, and the more the bounce rate increases – up to +123% for 10 seconds of loading time.
This has a direct, albeit marginal effect on SERP ranking. Suffice it to say that this metric plays a major part in the success of a website. Fortunately, there is one tool that can help you measure and improve a site’s speed, and that is Google PageSpeed Insights. How does it work, exactly?
What is Google PageSpeed Insights?
PageSpeed Insights is a tool that Google released back in 2018. It is entirely free, and aimed at anyone who develops, operates, or optimises websites. By typing the desired URL into the dedicated field, you can launch a page analysis to find out all you need to know about its loading speed, either in its desktop or mobile version. The idea is to then be able to remove stumbling blocks to improve how quickly the page in question gets displayed.
Google PageSpeed Insights is not the only tool on the web to offer this type of audit. Many other solutions work on the same principles. With that said, what makes Google PSI (for those in the know) so special is the richness of the information it provides about the Chrome user experience: site speed score, lab data (taken from Lighthouse), field data (Collected through the Chrome UX Report and real-life user experience), diagnostics, and suggested improvements. The tool thus generates a very comprehensive report.
In addition to that, the Google Page Speed Insights tool considers the mobile version of a page – when it exists – first. Knowing that the search engine’s Mobile-First Index values mobile optimisation, this analytical focus makes perfect sense.
Web page loading: does speed really matter?
Without knowing how important this metric is, one may legitimately wonder about the point of a tool such as Google PageSpeed Insights.
To better understand it, ask yourself this simple question: As a user, would you stay on a page that takes longer than five seconds to load? The answer is most probably “No”. In the world of the Internet, speed is a virtue, and search engines encourage webmasters to optimise their sites so that their pages are displayed as rapidly as possible, and ideally in less than three seconds (to quote John Mueller, Senior Webmaster Trends Analyst at Google).
A study conducted by Google in 2017 thus showed that an increase in page loading time results in a proportional increase in bounce rate:
In parallel, Backlinko analysed five million pages (both in their desktop and mobile versions) in 2019 and came up with the following figures: on average, it takes 10.3 seconds for a desktop page to be entirely displayed, versus 27.3 seconds for a mobile page.
And everything goes to show that the user’s expectations in terms of speed have become increasingly strict since then, all the more so with the development of mobile Internet. It turns out that mobile Internet users are even less patient than their desktop counterparts. 85% of them expect pages to load more quickly on a mobile device than they do on a computer. A British study even revealed that 14% of the customers want to see pages show up instantaneously on their mobile! (All the figures are in this article.)
And that isn’t all! Beyond the impact it has on the user experience, page loading speed also influences SERP rankings. This metric even counts as a key factor in SEO. This is because the algorithm relies on a simple equation: providing the most relevant answers while demanding the minimum amount of effort from the users. In that respect, a page’s load time can affect its ranking in several ways:
- if the users leave the page within seconds after they arrive (which impacts the bounce rate),
- if the page’s constituting elements take too long to load,
- if it takes too long to be able to interact with the page (and receive an answer).
Since the implementation of the Core Web Vitals, Google has been going even further in measuring the performance of web pages. These three factors consider technical issues that could impact the user experience significantly, such as the time it takes for the largest element on the page to be displayed, the time that elapses between an interaction and the browser’s response, and where the clickable elements are positioned on the page.
This is where the Insights from Google Page Speed comes in. This tool makes it possible to measure the speed of a web page and to identify any roadblocks that could slow it down.
What data does Google PageSpeed Insights provide?
Once it has carried out an audit on a web page, Google PageSpeed Insights provides a certain amount of data. Let’s take a look at the information you can find in the final report (which, as a reminder, only applies to a single page).
PERFORMANCE SCORE
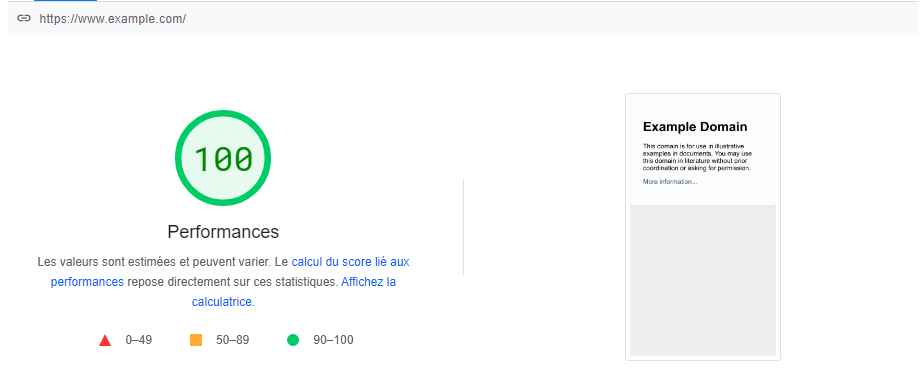
The score takes the shape of a rating awarded to a web page by Google PageSpeed Insights based on its technical performance ranging from 0 to 100. This score is derived from statistics produced by the Lighthouse tool. Reading the score is as easy as could be, thanks to a convenient colour code:
- In green, scores between 90 and 100: satisfactory speed.
- In orange, scores between 50 and 89: moderately acceptable speed.
- In red, scores between 0 and 49: slow web page.
Six statistics are used for calculating the score:
- First Contentful Paint
- Time to Interactive
- Speed Index
- Total Blocking Time
- Largest Contentful Paint
- Cumulative Layout Shift
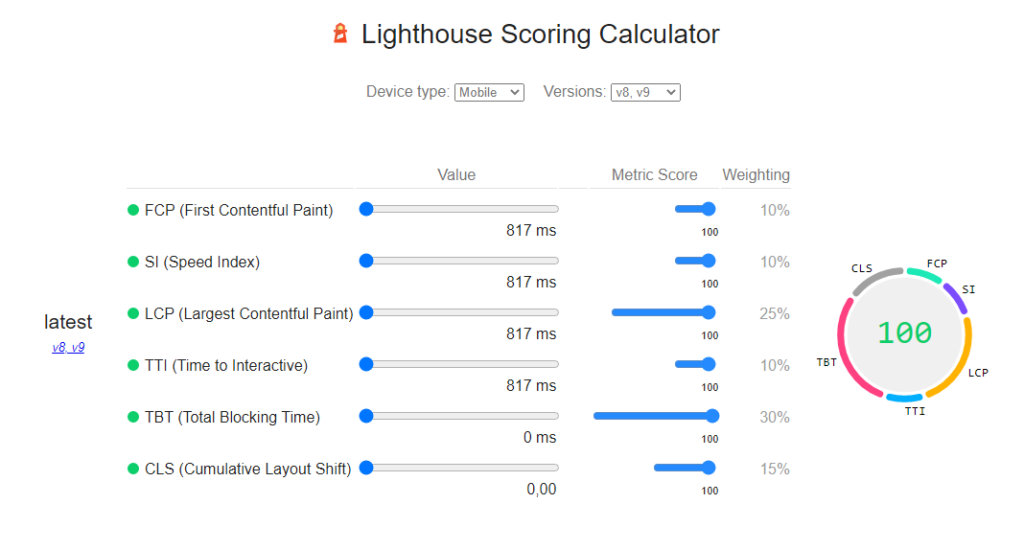
Each one of these indicators has its own score, which measures a very specific criterion. The average of the six scores – with the right coefficient applied – determines the final rating. For instance, the Total Blocking Time accounts for 30%, while the First Contentful Paint accounts for 10%. You can check the calculation details derived from Lighthouse by clicking the “calculator” button right below the speed score. You can play around with the values to see how the changes influence the calculation of the end score.
For obvious reasons (the notion of “rating”, the instinctive colour coding…), the performance score is inordinately important to Google PageSpeed Insights – sometimes bordering on obsession. And yet, this indicator deserves a more tempered qualification. Instead of taking it as a final judgment, it should be seen as a compass to guide us in the right direction.
In that regard, it’s worth noting that the statistics taken from the Lighthouse API are produced in a controlled environment, which reproduces the display conditions for a page by considering predefined settings. These stats are also called “lab data” because these conditions simulate the display conditions of the page on desktop or mobile without any consideration for real-life user experience. Which means that this method, effective though it might be, does not identify how a page slows down under real conditions. A simple analogy could be the difference that exists between testing a plane using a flight simulator and actually piloting it!
CORE WEB VITALS
This assessment integrates the now famous Core Web Vitals. These signals allow Google PageSpeed Insights to perform a detailed analysis and provide a user experience report relating to a specific web page by relying on (and this is crucial) real-life data from the users. What are these vitals?
- Display of the first element on the page (First Contentful Paint)
- Display of the largest element on the page (Largest Contentful Paint)
- Time elapsed between the interaction and the response from the browser (First Input Delay)
- Stability of the page’s visual elements as they get displayed (Cumulative Layout Shift)
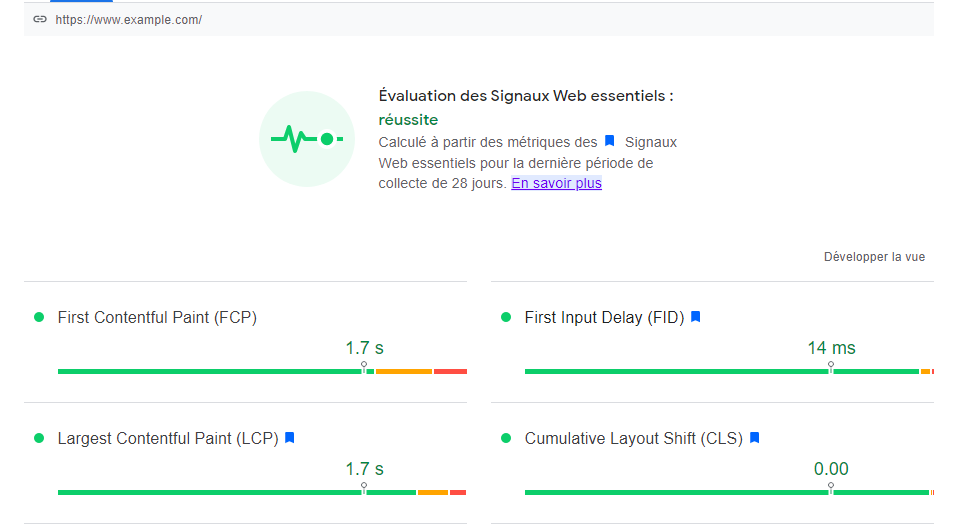
The values used here are taken from the Chrome UX Report, which provides metrics about how websites have actually been used over the past 28 days. When the data is not available, the Google PageSpeed Insights report states so clearly. Because it is closer to what is truly going on, this information can help you understand how Internet users interact with a page and, ultimately, it will help you measure its level of performance. It is all the more interesting that, being the world’s prime search engine, Google can rely on a vast amount of data.
DIAGNOSTIC
At the end of the report, Google PageSpeed Insights provides users with “opportunities” in the form of a performance diagnostic. These opportunities are just as many suggestions to be implemented for page speed optimisation and to improve the metrics results, thus boosting the page’s score. Through a set of colours and geometric shapes, you can see possible improvements likely to generate better results at a glance. A red pyramid designates a priority action, whereas an orange square indicates a secondary lever. (Note that it is possible to filter which type of metric you want to show.)

These potential improvements to boost a page’s loading time can be very diverse. Here are a few examples:
- Eliminating pointless resources that obstruct the page – usually scripts (Javascript files or CSS)
- Reducing the number of requests to speed up the server response time.
- Optimising images and videos (the largest files) by compressing or resizing them.
- Limiting the use of 301 redirects.
- Activating Gzip compression for mobile display.
- Etc.
When the diagnostic is complete, Google PageSpeed Insights also provides details about “successful audits”. These show the performance requirements the page already meets fairly well based on the users’ and indexing robots’ expectations.
Does your Google PageSpeed Insights score have an impact on SEO?
This has to be THE question you are asking yourself now that you know how to use PageSpeed Insights: Just how much does this data influence your page’s SEO ranking?
This is a twofold answer:
- The loading speed is a ranking factor on Google, which means that the search engine partly relies on the results from the Google PageSpeed Insights audit to rank the pages in the SERP.
- And yet, at the same time, the site’s performance score as such is not a search engine optimisation lever. It is still the page’s loading time that is considered, since it impacts the user experience. This means that a “green” score in Google PageSpeed Insights does not guarantee a higher ranking in the search results at all.
The score doesn’t have a direct influence on a website’s SEO. It has a different role: to demonstrate the issues faced by the user when navigating a page, and to allow the webmaster to correct them. Which leads us directly to the limitations of this tool…
What are the limitations of Google PageSpeed Insights?
Google PageSpeed Insights is a convenient and effective tool used by countless professionals. And yet, it does have some limitations that are important to know, especially those that relate to the notorious performance score. Many webmasters take this score as Gospel and drive themselves mad trying to reach the highest mark. Even if page speed is important, the true question should probably be: What relevant information does this score provide?
In fact, there exist multiple levers that can help you optimise your Google PageSpeed Insights score without improving a page’s true performance at all – which is to say without changing the quality of the user experience. For instance, this can be done by messing with the source code. Yet, the goal should not be to convince Google that a page performs well, but indeed to offer a great experience to the users by truly boosting the page’s loading time.
For this reason, you will be better off forgetting about the score as such and focusing on three, much more important aspects:
- The suggestions shown in the diagnostic, which could dramatically improve a page’s loading time.
- The performance as perceived by your users, who don’t care about the Google PageSpeed Insights score you received – and just rely on the experience they had on your website.
- The page’s loading time in their mobile versions because this is where most of the technical issues will materialise (according to Backlinko, the same page takes on average 88% longer to load on a mobile device than it does on a desktop). The problem is that a page can get an excellent score in its desktop version, and yet boast mediocre performance in its mobile version, which therefore needs to be optimised specifically.
All in all, the point of Google PageSpeed Insights is not to start a race towards the most impressive score, but to encourage webmasters embrace best practices and to improve their pages’ loading speeds in order to offer a better user experience. These actions have the merit of having a positive impact on the users AS WELL AS on the indexing robots. Thus, a page that loads more rapidly tends to minimise its bounce rate, to boost its conversion rate, and to increase the robots’ crawling speed and indexing rate, ultimately improving search engine optimisation.

Need to talk with an expert?